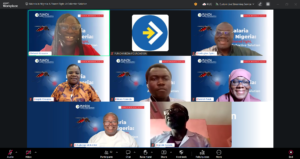
Code for Africa, a civic-technology organisation, in partnership with the PUNCH Media Foundation, organised a data journalism webinar series for select reporters in PUNCH’s newsroom and other newsrooms across Africa, to equip reporters with requisite data skills that will position them as better influencers through data-based reporting. The bi-weekly training started on Wednesday, 18 August, and ran through Wednesday 10 November 2021. Participants at the training are journalists from newsrooms across African countries including Kenya, Tanzania, and Uganda.
The first session of the data journalism training was an “Introduction to the basics of data journalism”. John Eromosele, a civic technologist at Code for Africa, who facilitated the session, remarked that data journalism entails developing the digital skills to gather, interpret and visualise data. He added that data journalism is one way to enhance news reportage with the use and introduction of statistics to stimulate public engagement. Furthermore, he spoke on the importance, philosophies, and challenges of data journalism.
“Finding and telling stories with data” was the focus of the second session, also facilitated by John Eromosele, who mentioned by way of introduction that data in itself may not be interesting, but when stories are used to project data, they tend to attract attention more as people can relate better to the data and understand how it affects their lives. Therefore, to find stories in data, John noted that reporters must be able to point at the most important things in a given data. Other focus areas of the second session included data-driven processes, uses of data stories, and identifying pattern in data that makes a story compelling.
The third session of the training, facilitated by Joseph Dokhare, was on “Introduction to spreadsheet”. Joseph took participants through the practical session on how to use Google spreadsheets in collaborative work. He described a spreadsheet as a basic visual representation of raw data, which can be manipulated and analysed to find meaningful insights. He cited that Google sheet is a flexible spreadsheet that allows live collaboration, enables ‘share’ for others to view and comment, can be saved in the cloud and thus accessed from any device and anywhere there is an internet connection, among others. Other areas addressed include creating Google sheets, identifying cell references, sharing a Google sheet, data structure, shortcuts in Google spreadsheet, naming sheets, renaming sheets, duplicating sheets, and downloading spreadsheets as XLS and CSV.
“Data Scraping: extracting data from non-machine readable formats” was the focus of the fourth session, which was facilitated by Faith Kemunto, a data analyst with Code for Africa based in Kenya. Faith noted that data comes in different forms and structures, mostly in human-readable formats. Hence, with data scraping, human-readable texts can be converted to machine-readable format.
Furthermore, she stated the benefits of data scrapping but warned that the terms of use of any data should be checked before they are subjected to data scraping. During the practical session, an online tool was used to download tables in pdf format as spreadsheets for further deductions, insights, and analysis.
The fifth in the series was facilitated by Emma Kisa, a Kenya-based data analyst with Code for Africa. Her focus was on “Finding a story in a spreadsheet”. Emma, in her introductory remarks, noted that a good data story explains how data is relevant to an audience, and what the audience should do about the data. To find a story in a spreadsheet, Emma charged participants to look out for insights such as what is interesting or unexpected, what is missing in the spreadsheet, or the most common element in the spreadsheet.
The sixth session, “Introduction to data visualisation” was facilitated by John Eromosele. He described Data visualisation as the process of converting a large amount of numerical or text data to an accurate visual form that can produce insights. He indicated further that data visualisation is different from infographics in that it is simplified for the non-scientific population. In making data visualisation, John pointed participants’ attention to the anatomy of a chart – title and subtitle, legend, data labels, sources and logo, Y-axis, and X-axis. He introduced Flourish and Canva as software that are very useful in data visualisation. Some of the visualisations used for the training included, Bar and column charts, line and area charts, pie charts, geographic visualisation using maps and satellite imagery.
Zahara Tunda, a data analyst with Code for Africa based in Tanzania, facilitated the last session in the webinar series on “Data sharing and publishing”. She emphasised the need for proper organisation and presentation of data to provide users with adequate information. She referred to the quote by Daniel Keys Moran which says, “You can have data without information, but you cannot have information without data”. Lastly, she introduced the openAFRICA, a grassroots initiative maintained by Code for Africa, as an open data platform for researchers, journalists, government, and civil society.
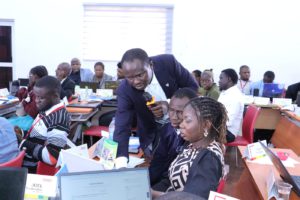
The data journalism webinar series featured practical sessions as well as dedicated mentoring sessions which allowed participants to apply the various topics learned in key areas of their work while engaging resource persons for maximum learning outcomes towards better data-driven reportage.